Power BI Connector

Positive Star RatingPositive Star RatingPositive Star RatingPositive Star RatingPositive Star RatingEmpty StarEmpty StarEmpty StarEmpty StarEmpty Star
Owlfred RecommendedOwlfred RecommendedOwlfred Recommended
7
Reviews
7
Reviews
0
Installs
Transform your data into powerful visuals with the leading Power BI Connector app.


What Owlfred thinks...

Power BI Connector is a great tool to transform your data into rich visuals and organize it the way you want, helping you uncover valuable insights and stay ahead of the competition.

This is a great Shopify app that will help you grow your Shopify store faster!

Last Updated:
September 6, 2024

Transform Your Data with Powerful Analytics & Visualization for Your Business

Find it on the Shopify App StoreFind it on the Shopify App Store
Get Started

Immerse your eCommerce business into the realm of data-driven enlightenment with this supercharged analytics solution. Transform data into a visually intuitive interface that reveals key insights and aids in strategic decision-making. This application serves as a non-stop conduit, transporting valuable data into comprehensible graphs and charts that make complex analytics a breeze.

This cutting-edge solution consolidates unstructured data, offering a bird's-eye view of business metrics and enabling merchants to easily comprehend and utilize their online store's data. It offers a powerful platform to bridge the gap between raw data and constructive business insights, effectively arming eCommerce enterprises with the right tools to stay competitive.

Stored data becomes functional intelligence through this application's robust framework. Data visualization is taken to new heights with easily digestible graphics, striking a balance between aesthetic appeal and functionality. Hence, facilitating the delivery of quick, actionable information that propels businesses towards growth.

A firm commitment to forward-thinking solutions endorses this application's role as a comprehensive, easy-to-deploy platform that adheres to both current and anticipated needs of an online business. Not only does it translates as a modern and dependable addition to your data analytics toolbox, but it also exemplifies its role as a long-term partner aiding the voyage of navigating the competitive eCommerce landscape.

Features

Create stunning interactive reports
Daily automatic updates
Build convenient dashboards
Transform raw data into visually intuitive insights for strategic decision-making
Bridge the gap between unstructured data and constructive business insights for merchants

Benefits

Transform raw data into visually intuitive insights that aid in strategic decision-making
Bridge the gap between unstructured data and constructive business insights, helping merchants easily comprehend and utilize their online store's data
Deliver easily digestible graphics and actionable information that propels businesses towards growth

About the Vendor

Image Optimizer
20 Ocean Street, Bondi, NSW, 2026, AU
Visit Vendor Website
20 Ocean Street, Bondi, NSW, 2026, AU Map

Works with

Pricing

From $49/month. Free trial available.
We have detected the following pricing bands for this app are as follows:
Minimum Price:
$
49.00
MaximumΒ Price:
$
299.00
All charges are billed in USD. Recurring and usage-based charges are billed every 30 days. Pricing may differ to that listed above, please check the link below for accurate and up to date pricing details.
See all pricing options

Deal available!

View Deal

Review Trend Insights

0 review in the last 30 days.

0 reviews in the last 30 days.

0 review in the last 90 days.

0 reviews in the last 90 days.

Install Trend Insights

0 install in the last 30 days.

0 installs in the last 30 days.

0 install in the last 30 days.

0 installs in the last 30 days.

Owlfred Review

Who doesn't love a good data visualization? Right? Power BI Connector may be exactly the magic wand you're looking for, or maybe not. Despite having a stunning bold promise to turn your data into rich visuals and further organize this any way you fancy, there is a bit of a hiccup: the average rating stands at 2.1 based on six reviews. Now, don't pooh-pooh this app based on that, because it's critical to remember that this backend app could have been providing businesses with the kind of pizzazz visualizations they desired without actual public installs tracked. The absence of this doesn't quite quell our optimism. With a price range of $49 to $299 a month, Power BI Connector allows the creation of interactive reports, automatic daily updates, and building of convenient dashboards. And as we've picked up from the stall chatter, (there's a lot one can learn in the barn), analytics and data visualization tools are somewhat of an industry requisite to stay competitive, and who doesn't want to win? When looking at sales analytics apps, don't miss out on LoyaltyHarbour's Power BI Connector. In summary, despite the low rating, remember, even the underdog (or would it be underbird in my case?) can win the race. Or in this case, turn your analytics into a visual feast. Crunch those numbers and make up your own mind!

Owlfred Mixtape

See More Shopify App Songs

Promote This Shopify App

Copy and paste the provided badge code into your site's HTML. The featured badge links back to this page and the badge itself is an SVG so should scale to wherever you decide to place it!


Frequently Asked Questions

What is the role of Power BI Connector in sales analytics?
Power BI Connector helps you visualize and interact with your sales data on Shopify. It easily connects with your Shopify store, extracts valuable sales information, and allows you to analyze your sales patterns and trends in a user-friendly interface.
How does data transformation help in analytics?
Data transformation aids in analytics by ensuring the data is in the right state and format for analysis. For example, it might involve normalizing values, removing anomalies or outliers, or merging different datasets in a structured way. This makes data easier to work with, and enables you to derive more accurate insights.
What are the different types of data transformation in analytics?
Data transformation involves various types including normalizing, aggregating, decomposing and pivoting. Normalizing involves adjusting values measured on different scales to a common scale. Aggregating is combining two or more datasets into one. Decomposing involves breaking down a complex data item into smaller parts while pivoting entails rotating the data from one column into multiple rows.
How does analytics transformation lead to powerful insights?
Analytics transformation refers to the process of interpreting raw data and converting it into meaningful insights that aid in business decision-making. This involves data cleansing, validating, and modeling to derive conclusions, trends, and patterns that would have been too complex to see in raw data.

Shopify App Comparison: Power BI Connector vs Report Pundit : Custom Reports - which is better?

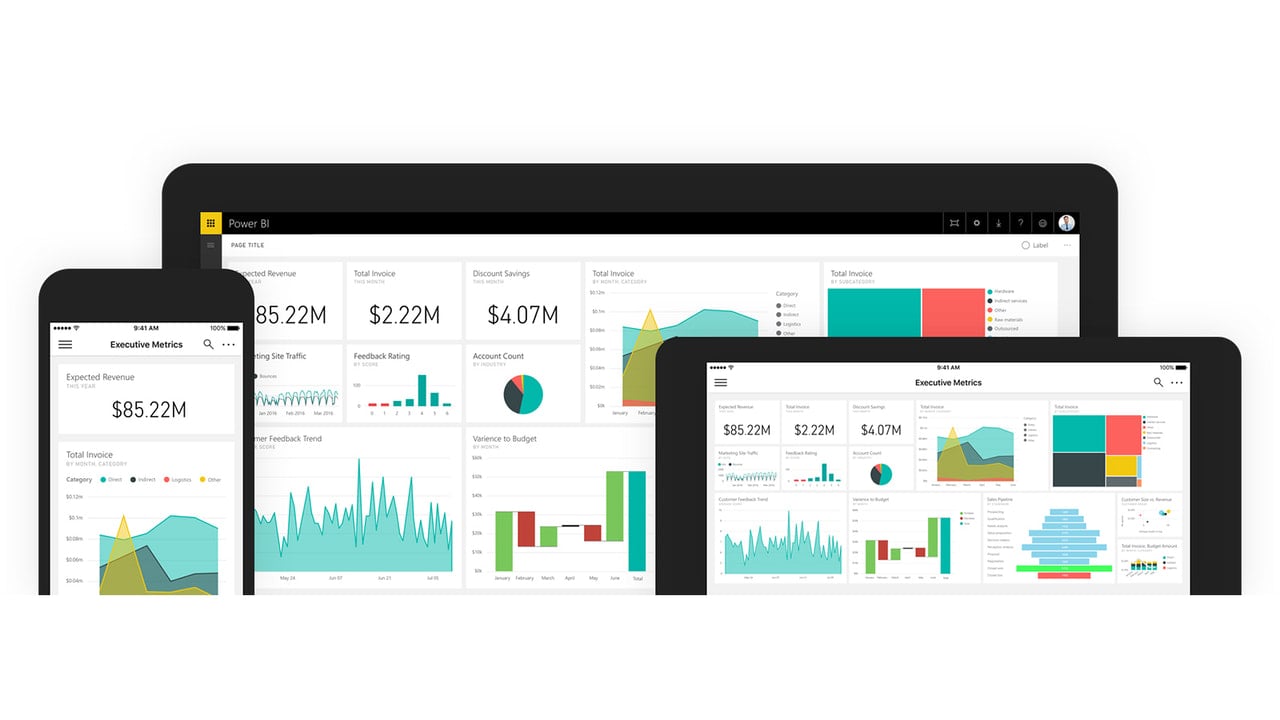
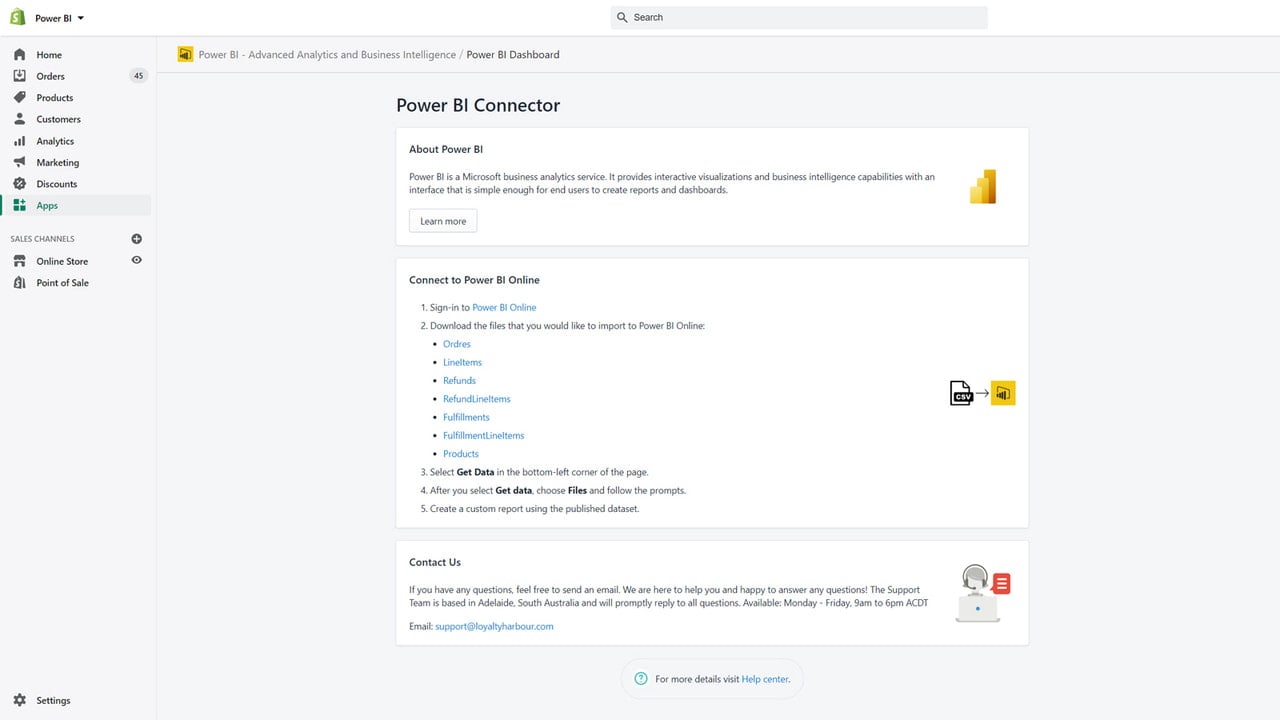
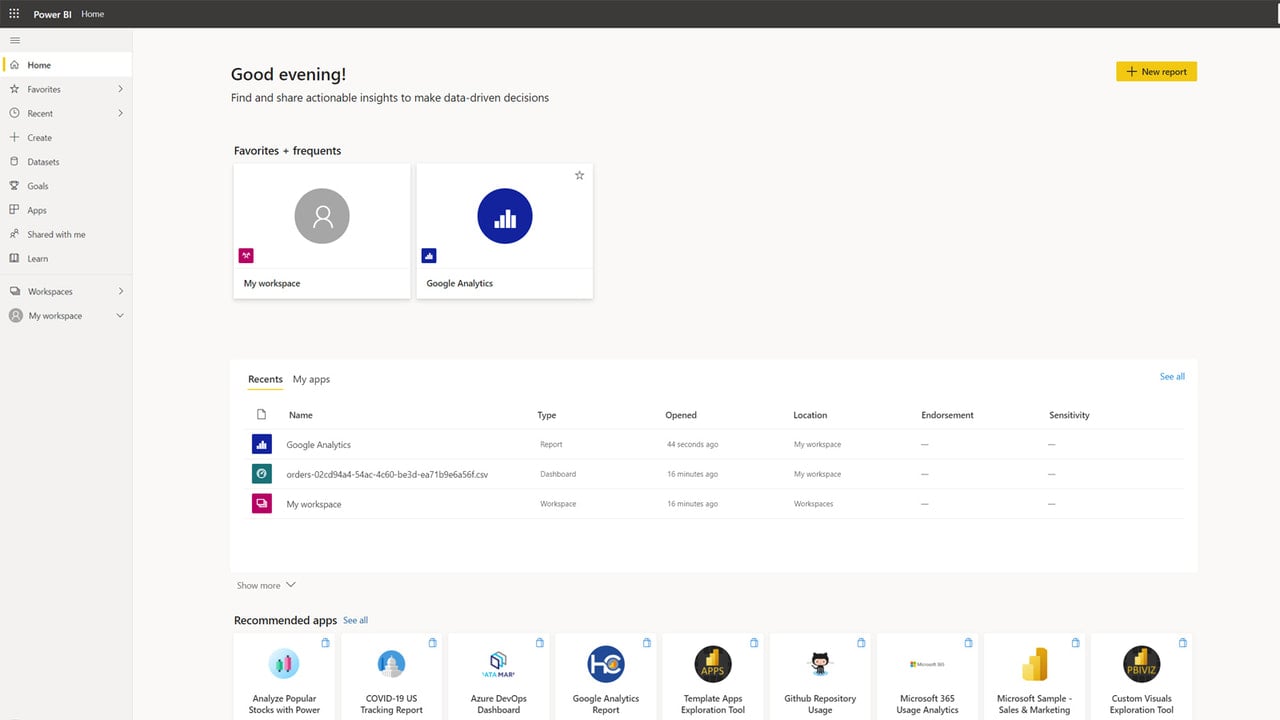
The Power BI Connector app is a cutting-edge solution that specializes in transforming raw data into visually intuitive insights. Its robust framework provides a powerful platform to bridge the gap between unstructured data and constructive business insights, making it easier for merchants to comprehend and utilize their online store's data. The app delivers easily digestible graphics and actionable information that propels businesses towards growth. With its stunning interactive reports and daily automatic updates, Power BI Connector ensures that insights are always current and relevant. This app is ideal for eCommerce enterprises looking to make data-driven decisions and stay competitive in the market.

On the other hand, the Report Pundit app is an advanced Shopify reporting tool that empowers users to generate custom-tailored reports based on their unique business needs. It offers a flexible and comprehensive platform that provides access to all Shopify data, making it easier to analyze key business metrics. With pre-designed reports and live chat assistance, users can quickly construct cohort tables, visual charts, and dashboards to present data in a concise and organized manner. The app also allows for easy data sharing through various formats such as Excel, CSV, or PDF files. Report Pundit is a comprehensive reporting tool that enables businesses to make strategic, data-driven decisions for growth.

Both Power BI Connector and Report Pundit offer valuable capabilities and features for data analysis and decision-making. While Power BI Connector focuses on transforming and visualizing data to aid strategic decision-making, Report Pundit provides a flexible platform with pre-designed reports and customization options. Depending on your specific needs, you can choose Power BI Connector for its powerful analytics capabilities or Report Pundit for its comprehensive Shopify reporting features. Both apps are recommended for eCommerce businesses looking to unlock the power of data and drive growth.

Attribute
Power BI Connector Shopify AppPower BI Connector
Report Pundit : Custom Reports Shopify AppReport Pundit : Custom Reports
Average Rating 1.7 out of 5 5 out of 5
Number of Reviews 7 1613
Estimated Installs 0 0
Min Price $49.00 $0.00
Max Price $299.00 $35.00
Works With
Install App

Share your thoughts

You might also like...

Recommended Shopify Apps