


When comparing HeatMap by Webyze and Retter-Heatmaps & Replay, both apps offer powerful data visualization techniques to help Shopify store owners understand user behavior and make strategic decisions. However, there are some key differences between the two.
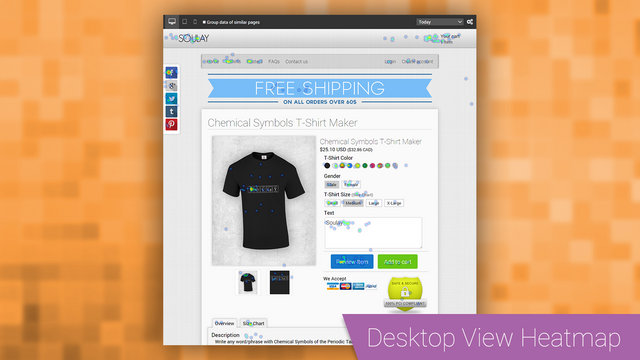
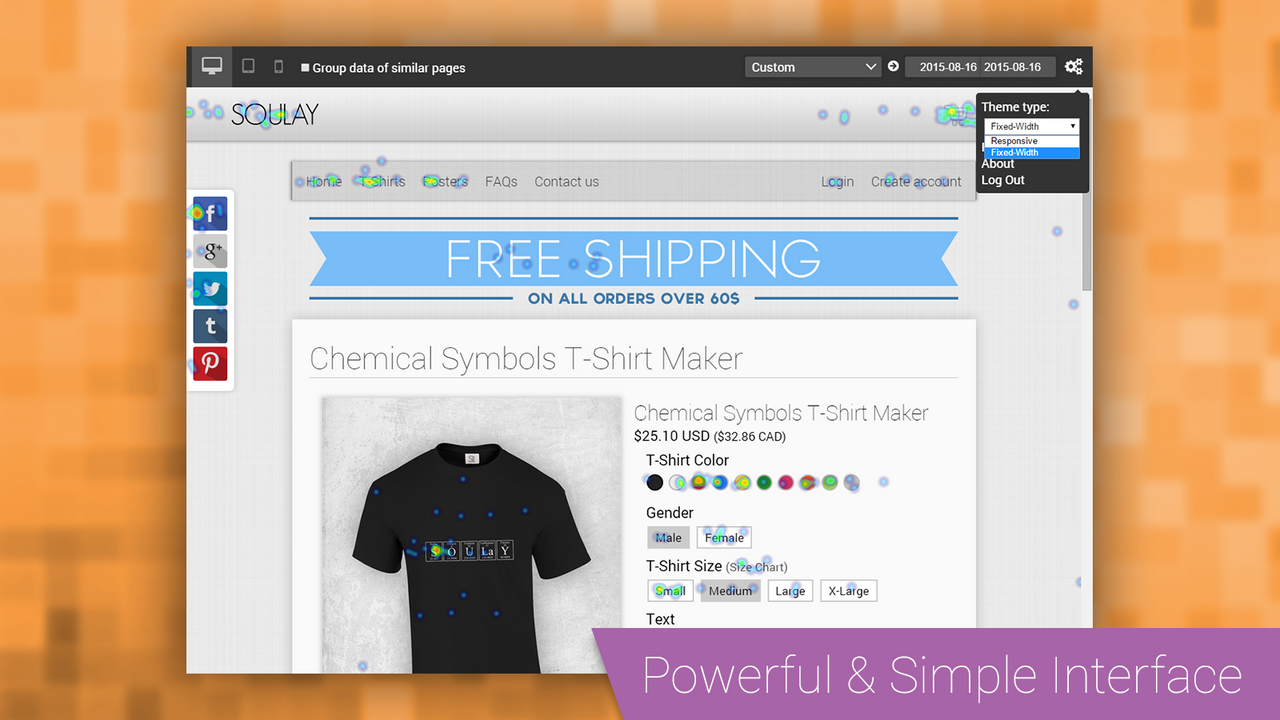
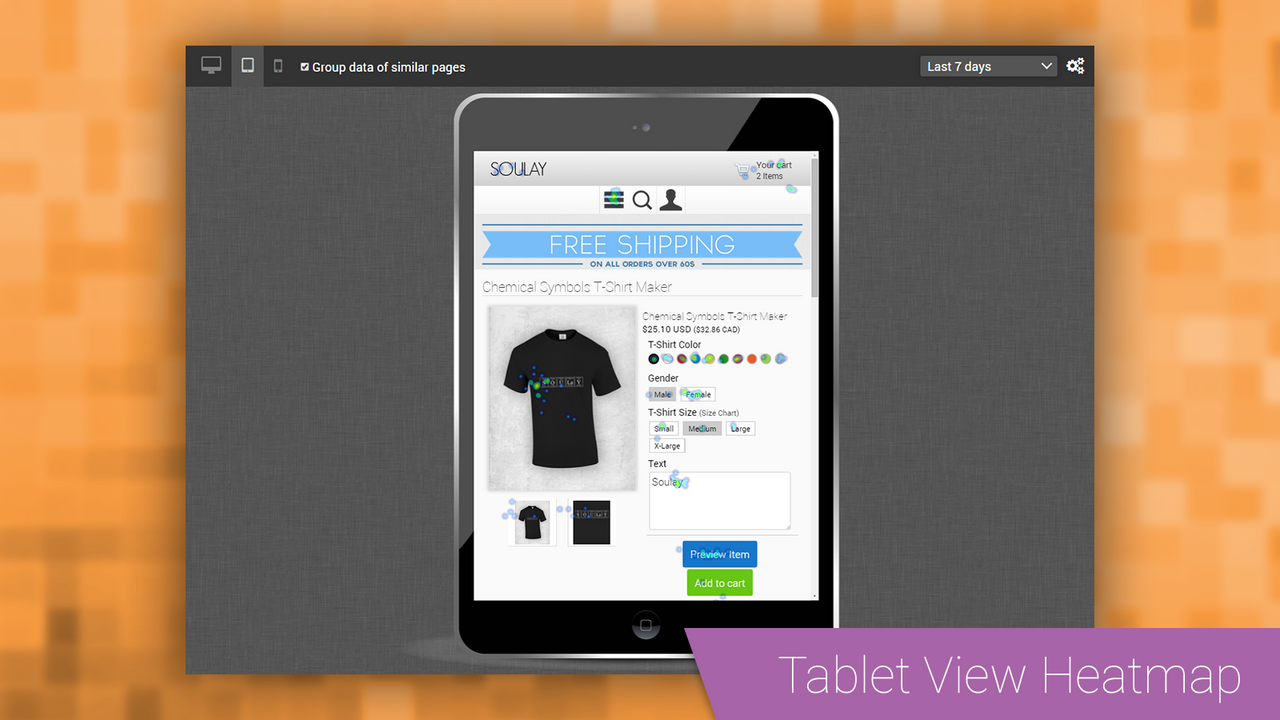
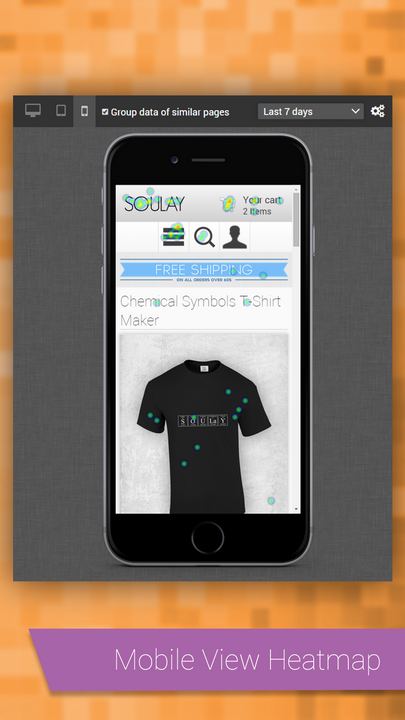
HeatMap by Webyze provides a color-coded, illustrative heat map that highlights the most frequently clicked areas on a website. This allows users to identify areas of engagement and potential concerns that could harm the user experience. With the ability to track unlimited page views and all pages on the Shopify store, users can gain valuable insights into user behavior patterns and make calculated decisions to optimize the layout and function of their website. The app supports all themes and allows filtering by device type, further enhancing its capabilities.
On the other hand, Retter-Heatmaps & Replay offers Session Record & Replay features, allowing users to trace and replicate the journey of site visitors. This app provides insights into how customers navigate different aspects of a Shopify store and what may be deterring them from making a purchase. Additionally, the Dynamic Heatmaps component helps users optimize interactive segments for maximum engagement and customer retention. The app also helps identify landing page problems with location, browser, and session data. With its sophisticated features, Retter-Heatmaps & Replay transforms raw data into actionable feedback for continuous improvement and sustainable growth.
Overall, both apps offer valuable insights and functionality, but the specific features and capabilities may vary depending on the needs and preferences of the Shopify store owner. Based on the provided descriptions, we would recommend both HeatMap by Webyze and Retter-Heatmaps & Replay for those looking to understand user behavior and make data-driven decisions to optimize their website.
| Attribute |  HeatMap by Webyze HeatMap by Webyze |
 Retter ‑ Heatmaps & Replay Retter ‑ Heatmaps & Replay |
|---|---|---|
| Average Rating | 1.2 out of 5 | 3.4 out of 5 |
| Number of Reviews | 5 | 48 |
| Estimated Installs | 0 | 467 |
| Min Price | $17.00 | $0.00 |
| Max Price | $17.00 | $19.98 |
| Works With | ||
| Install App | Get HeatMap by Webyze Get HeatMap by Webyze | Get Retter ‑ Heatmaps & Replay Get Retter ‑ Heatmaps & Replay |