How does this app compare?

Our team of resident Shopify nerds have reviewed 1000s of Shopify apps to help you make the best decision. Compare the top apps against your need below.
Last Updated:
August 23, 2024

Boost Revenue with Actionable Data

Find it on the Shopify App StoreFind it on the Shopify App Store
Get Started

Transform the way you perceive and analyze your landing page performance with this robust analytics tool. Stay ahead by understanding how every click adds up in your revenue, whether from buttons, links, or images. Is your Call-to-Action (CTA) pulling its weight, or does it require fine-tuning? Identify your highest-earning landing pages, pinpoint those underperforming and ensure your content marketing efforts are driving sales effectively.

Featuring a sophisticated yet user-friendly display, this app showcases revenue heatmaps that visualize the contribution of each on-site element to overall earnings, giving a comprehensive perspective on your overall conversion rate optimization (CRO). Harness the power of detailed insights to make informed decisions and steer your business towards profit maximization.

Don't just optimize, supercharge your online storefront based on solid data. With the aid of this tool, achieve enhanced CRO and bring the curtain down on guesswork. Tweak and refine your site elements using this app's clear, data-driven heatmaps and watch your revenues soar. Harness the fullest potential of every button and link for an optimized, high-performing Shopify store.

Features

Visualize revenue contribution of each on-site element with revenue heatmaps
Track revenue generated by blog post CTAs for content marketing validation
Utilize AB test heatmaps on landing pages for conversion rate optimization
Optimize high-earning landing pages and improve underperforming ones
Make quick adjustments and improvements with data-driven heatmaps

Benefits

Maximize revenue by identifying high-earning landing pages and optimizing underperforming ones
Increase sales by validating the effectiveness of your content marketing strategy through revenue tracking on blog post CTAs
Enhance conversion rates with AB test heatmaps that allow for quick adjustments and improvements

About the Vendor

SquidVision
1696 E Country Ln, Gilbert, AZ, 85298, US
Visit Vendor Website
1696 E Country Ln, Gilbert, AZ, 85298, US Map

Works with

Pricing

From $9.99/month. Free trial available.
We have detected the following pricing bands for this app are as follows:
Minimum Price:
$
9.99
Maximum Price:
$
199.00
All charges are billed in USD. Recurring and usage-based charges are billed every 30 days. Pricing may differ to that listed above, please check the link below for accurate and up to date pricing details.
See all pricing options

Deal available!

View Deal

Review Trend Insights

0 review in the last 30 days.

0 reviews in the last 30 days.

0 review in the last 90 days.

0 reviews in the last 90 days.

Install Trend Insights

0 install in the last 30 days.

0 installs in the last 30 days.

0 install in the last 30 days.

0 installs in the last 30 days.

Owlfred Review

Hoot-hoot! Today we're taking a peek at SquidVision Revenue Heatmaps. Making use of revenue heatmaps, this app gives you the inside scoop on how much revenue each button and link on your website churns out. Want to validate your content marketing strategy? You can monitor the revenue of your blog post CTAs. And when it comes to conversion rate optimization (CRO), simply run heatmaps on AB tests on your landing pages to quickly level up conversions. It has a solid average rating of 4.7 out of 5, based on 10 reviews, which is testament to its performance and reliability. Even though we can't track the number of installs as this is a backend app, it's sure to be a hit with merchants seeking to optimize their landing pages and elevate their sales analytics. It also comes with a friendly price point, starting at $9.99/month and offering a 14-day free trial. SquidVision is a promising pick for those looking to dive deep and truly understand their revenue generation.

Owlfred Mixtape

See More Shopify App Songs

Promote This Shopify App

Copy and paste the provided badge code into your site's HTML. The featured badge links back to this page and the badge itself is an SVG so should scale to wherever you decide to place it!


Frequently Asked Questions

How can SquidVision Revenue Heatmaps help maximize sales?
By providing an in-depth analysis of sales data, SquidVision Revenue Heatmaps allows business owners to identify successful selling points and areas of improvement. This can help to increase sales over time.
What is the role of data analytics in boosting my revenue?
Data analytics, provided by apps like SquidVision, allows businesses to understand customer behaviors and trends. This information can be used to optimize selling strategies, eventually leading to increased revenue.
What strategies can I use to increase my revenue using this app?
Using SquidVision, you can utilize heatmaps to identify high-traffic areas on your site and optimize your marketing strategies to target specific customer groups. This allows for increased engagement which can lead to higher revenues.
How are companies using big data provided by SquidVision to enhance sales?
Companies are leveraging the depth and breadth of big data provided by SquidVision to understand customer behavior trends, track sales performance, and optimize their marketing strategies. This helps to enhance the efficiency and effectiveness of sales efforts.

Shopify App Comparison: SquidVision Revenue Heatmaps vs Peek! ‑ Better Replay & Survey - which is better?

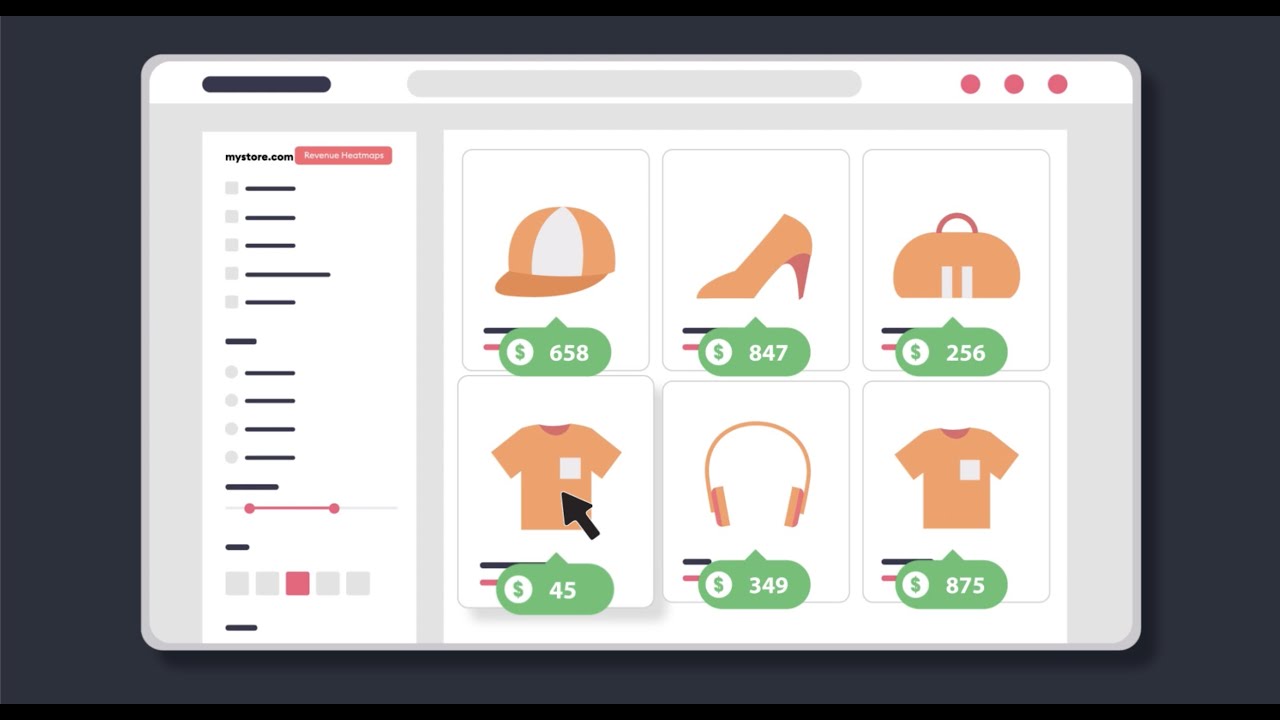
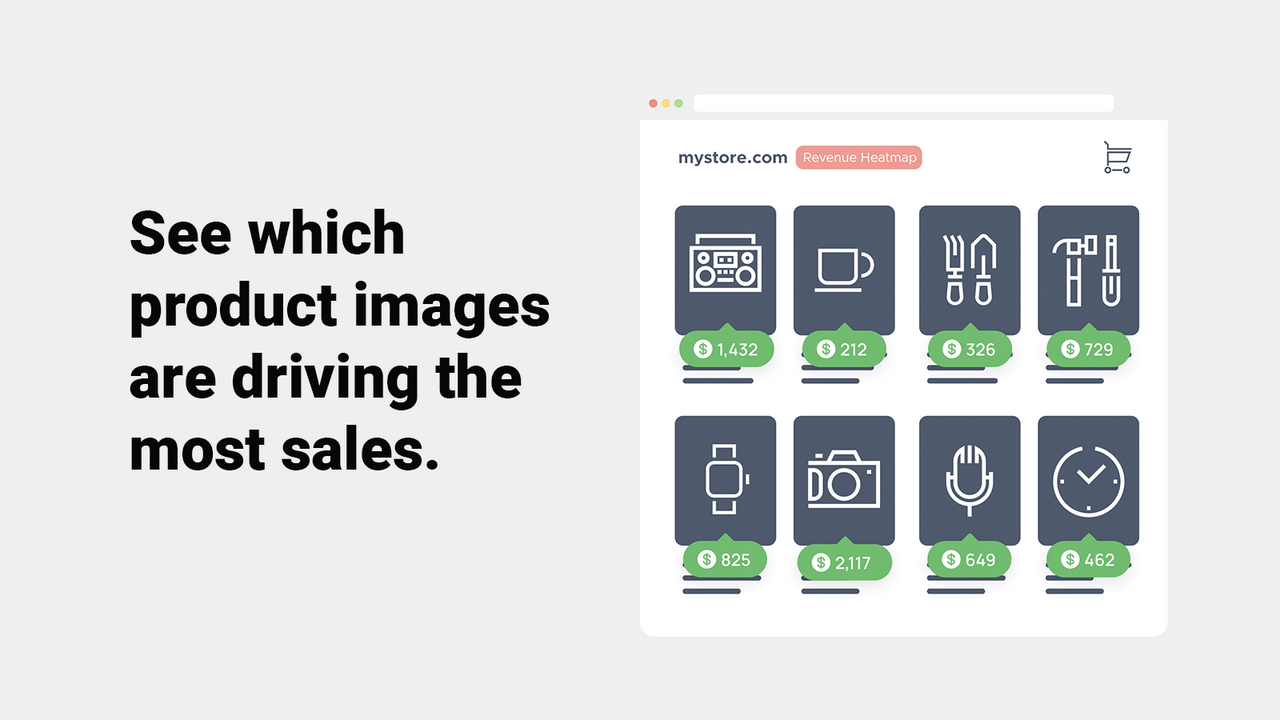
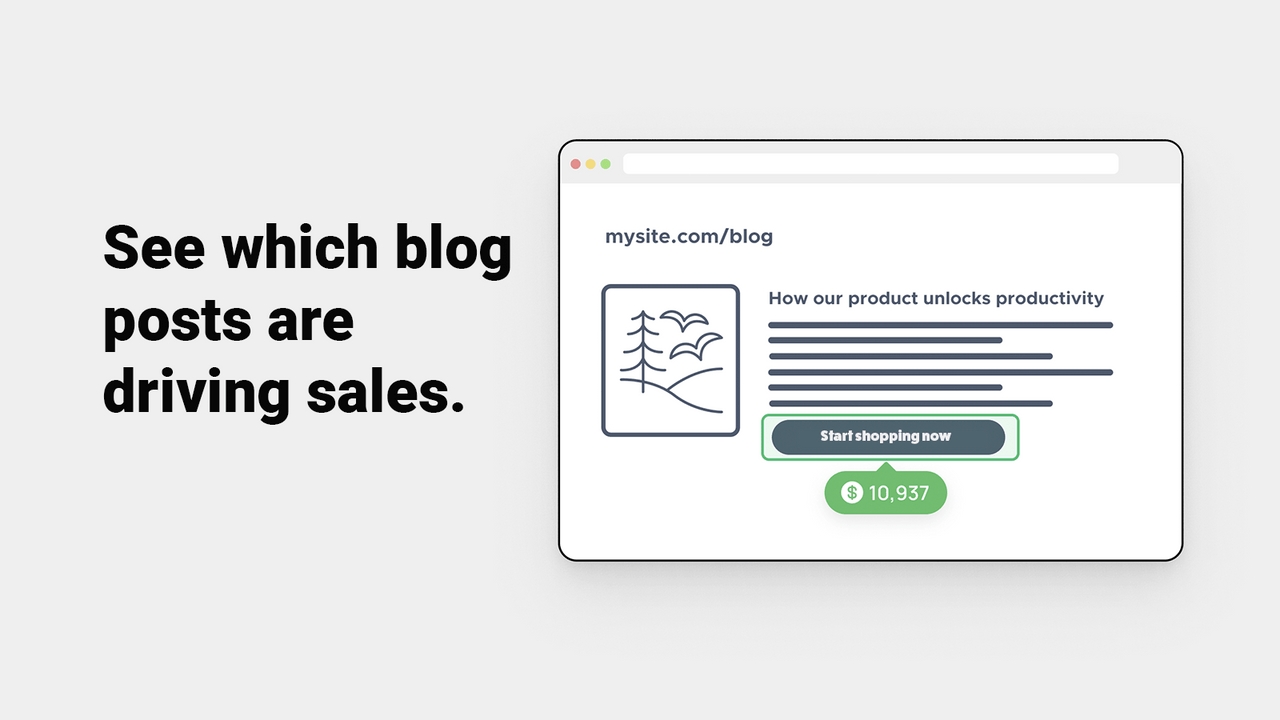
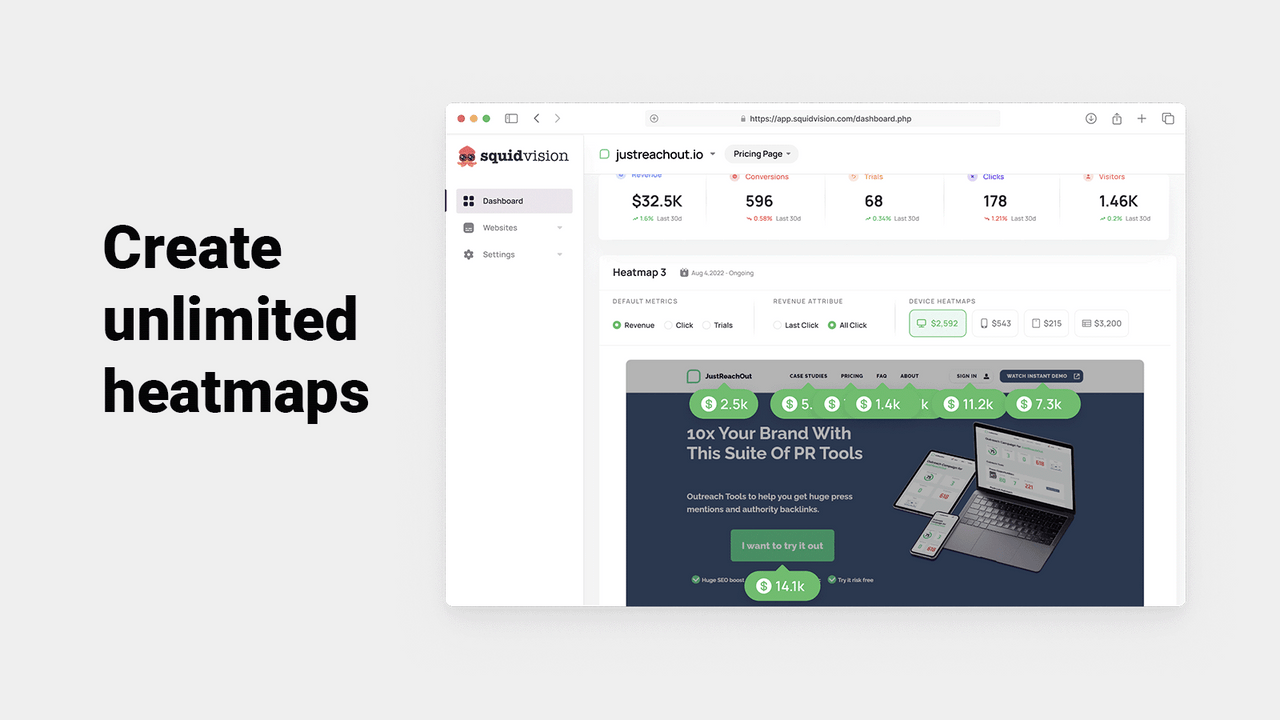
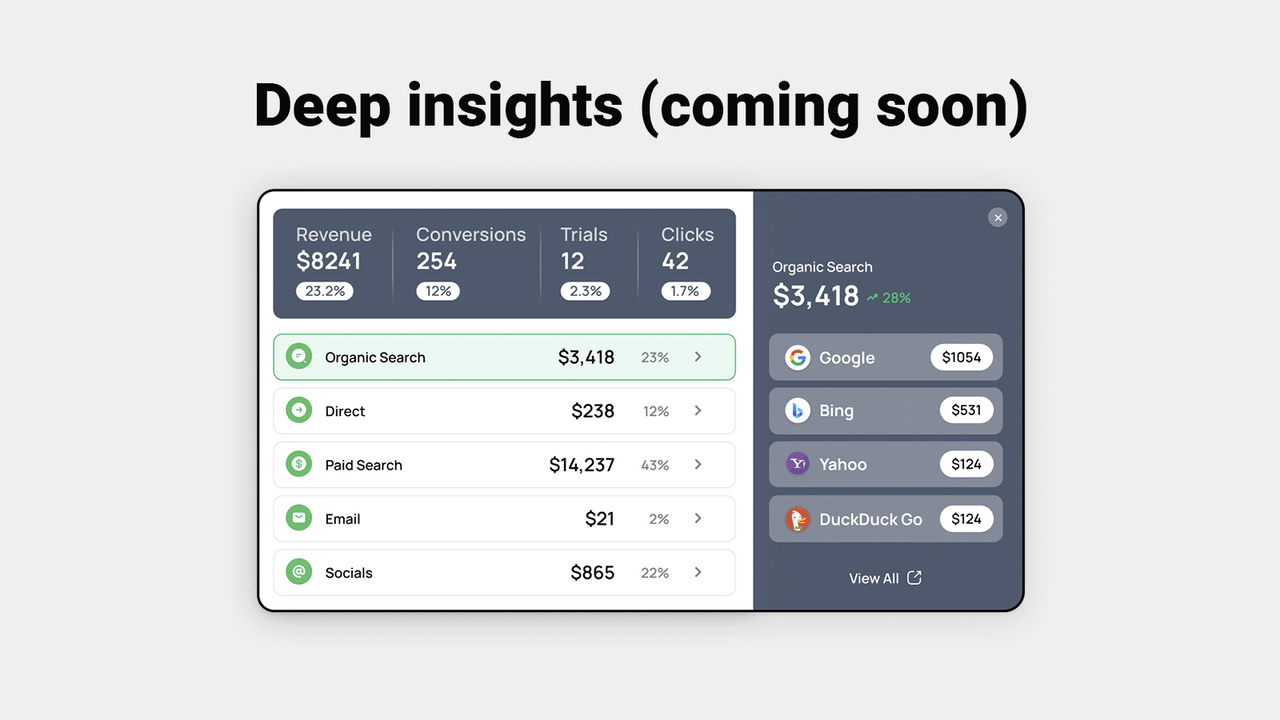
When comparing the capabilities of SquidVision Revenue Heatmaps and Peek! ‑ Better Replay & Survey, both apps offer unique features that can greatly benefit Shopify merchants. SquidVision Revenue Heatmaps allows users to visualize the revenue contribution of each on-site element with revenue heatmaps, providing valuable insights for optimizing landing pages and improving conversion rates. Additionally, it offers the ability to track revenue generated by blog post CTAs and utilize AB test heatmaps for further optimization. With SquidVision Revenue Heatmaps, users can maximize their revenue by identifying high-earning landing pages and validating the effectiveness of their content marketing strategy.

On the other hand, Peek! ‑ Better Replay & Survey focuses on customer behavior analysis and optimization through data-driven insights. It allows users to record detailed browsing sessions to uncover critical areas for store improvement and increase conversion rates. Moreover, this app enables direct communication with customers through post-purchase surveys, helping to address pain points and enhance shopper satisfaction. By utilizing Peek! ‑ Better Replay & Survey, Shopify merchants can gain valuable knowledge about their customers' expectations, make informed decisions, and improve overall performance.

Both apps offer unique capabilities, but we recommend SquidVision Revenue Heatmaps for merchants who prioritize revenue optimization and content marketing. SquidVision Revenue Heatmaps' revenue heatmaps and tracking features provide clear and data-driven insights for maximizing revenue and improving conversion rates. However, if customer behavior analysis and direct communication are a priority, Peek! ‑ Better Replay & Survey would be the ideal choice. Ultimately, the best app for each merchant depends on their specific goals and priorities.

Attribute
SquidVision Revenue Heatmaps Shopify AppSquidVision Revenue Heatmaps
Peek! ‑ Better Replay & Survey Shopify AppPeek! ‑ Better Replay & Survey
Average Rating 4.1 out of 5 4.8 out of 5
Number of Reviews 11 2684
Estimated Installs 0 3558
Min Price $9.99 $0.00
Max Price $199.00 $29.00
Works With
Install App

Share your thoughts

You might also like...

Recommended Shopify Apps