


Transform the way data communicates within your online store by leveraging visually appealing charts and graphs. This app empowers users to craft and oversee an extensive array of interactive data visualizations tailored to your branding and message.
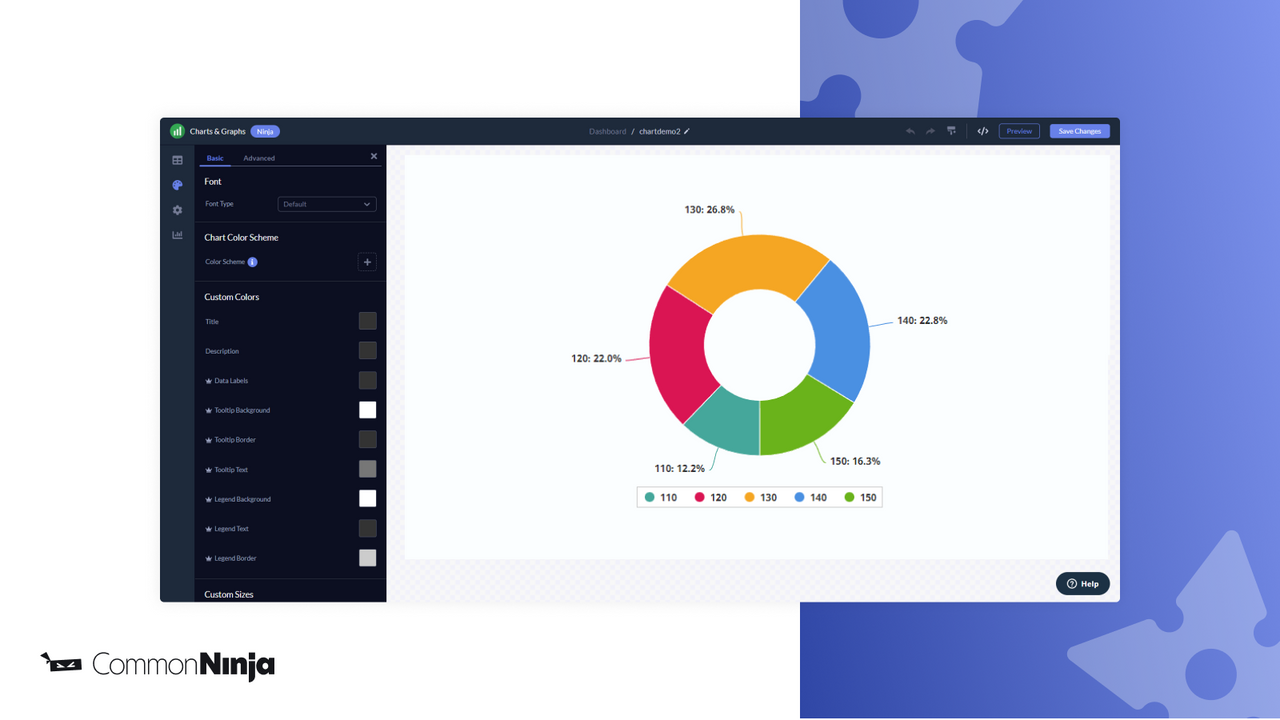
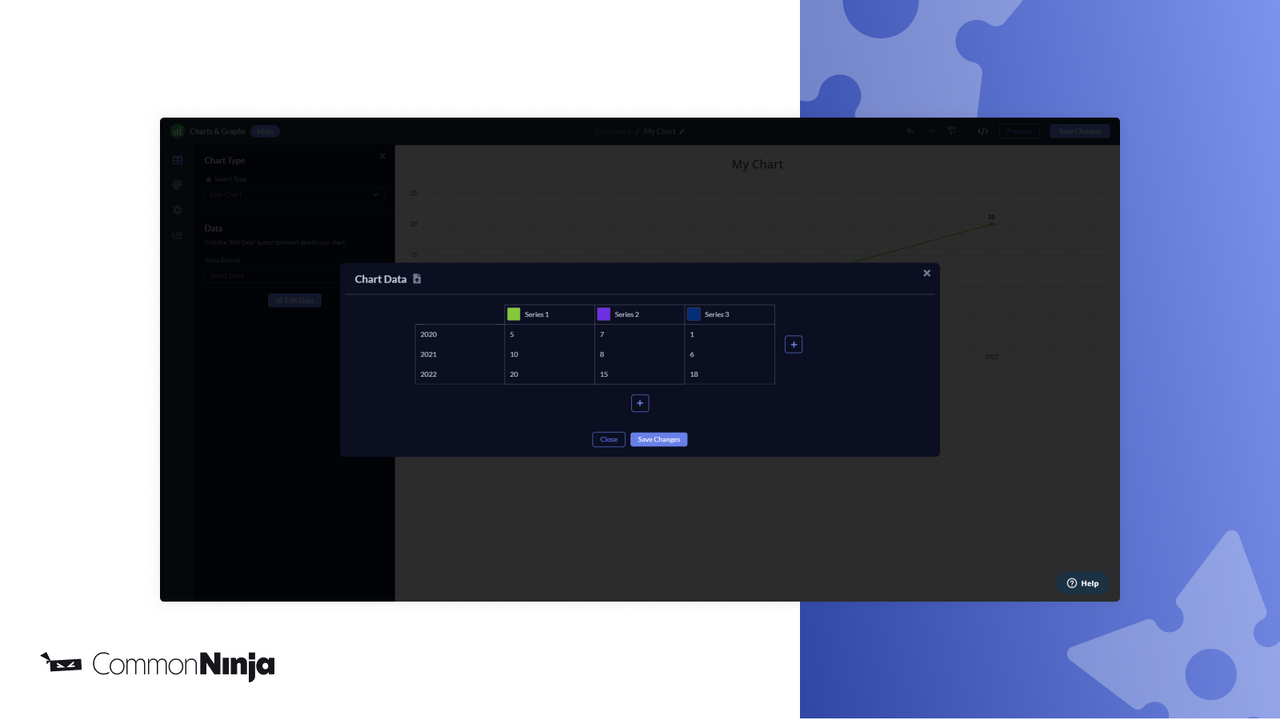
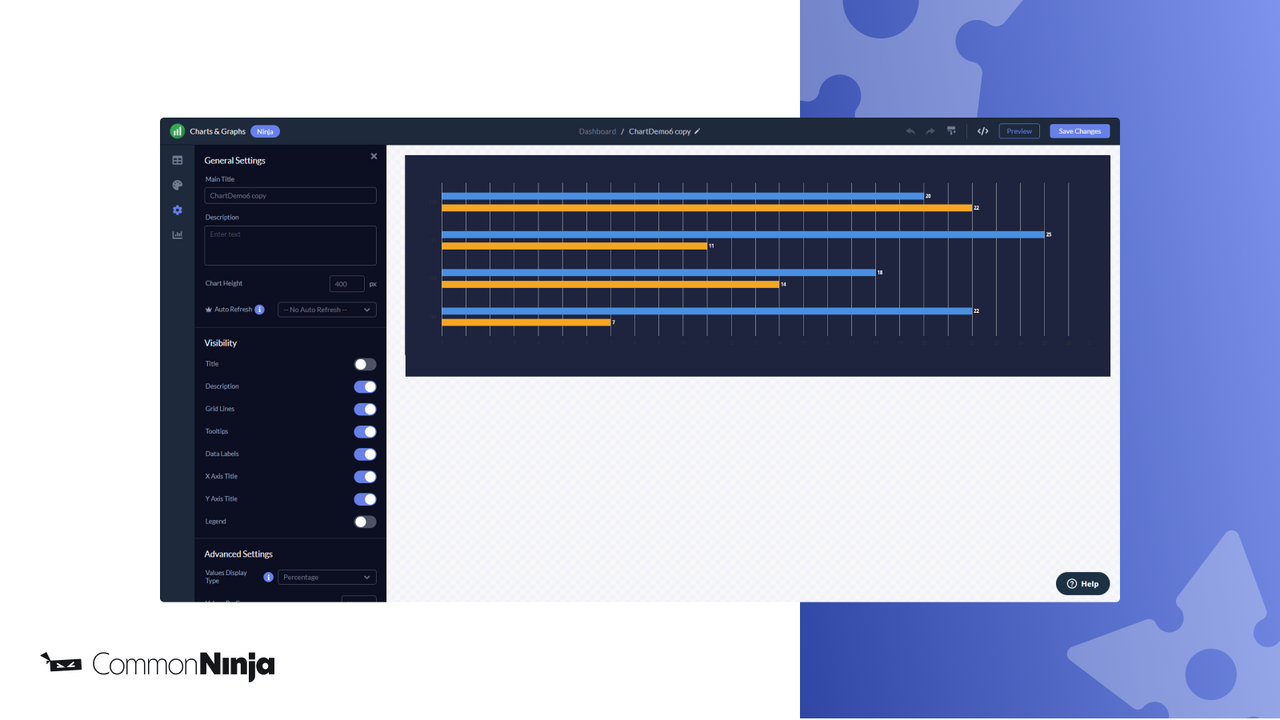
Customizability is at the heart of data representation here, allowing merchants to choose from diverse chart types and styles that captivate the attention of visitors. A streamlined spreadsheet interface simplifies data management, enabling effortless updates and real-time display adjustments.
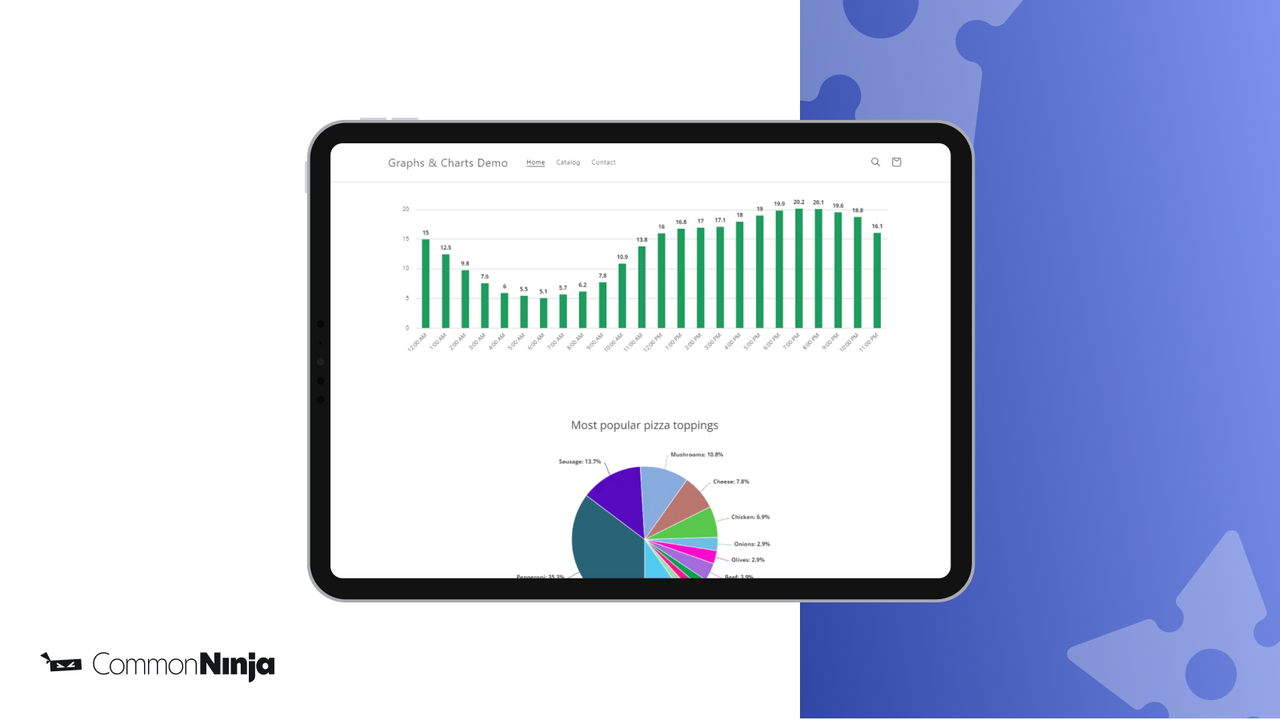
Engagement isn’t just about aesthetic; it’s about clarity. This tool ensures that essential information is not only visible but compelling, enhancing user understanding and retention. Make data a standout feature of your online storefront, driving informed decisions and interaction.

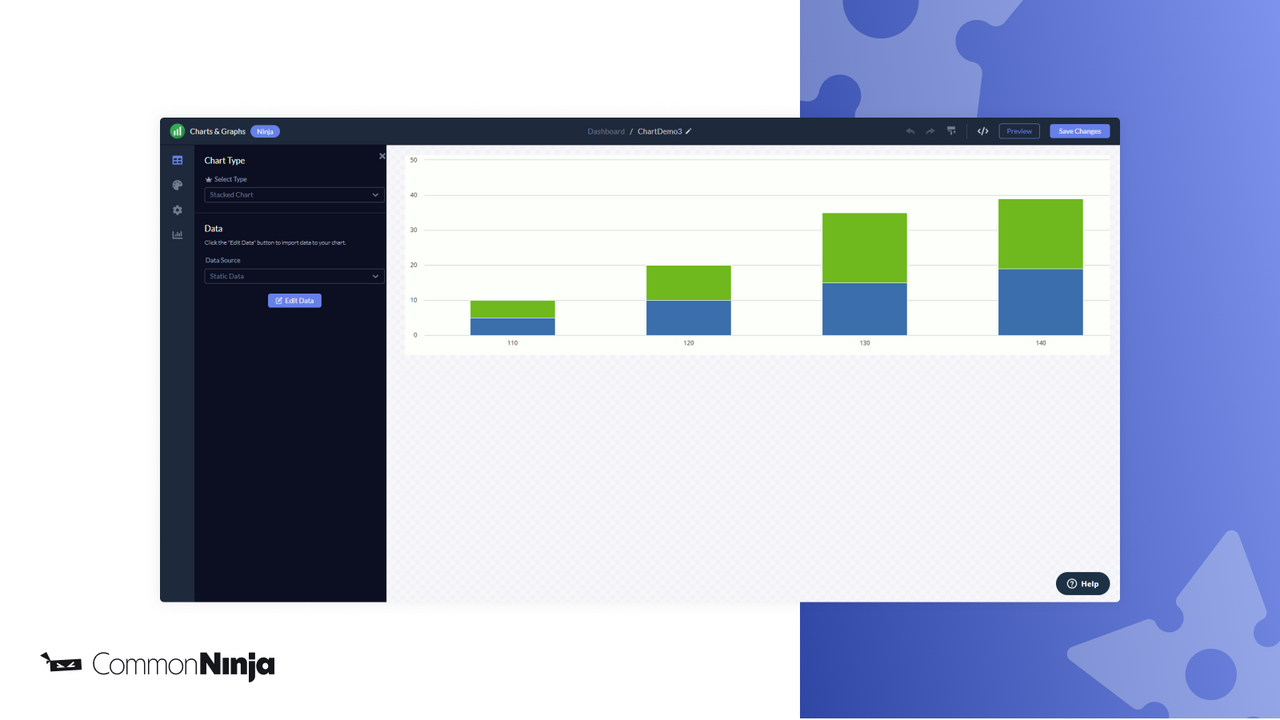

 Common Ninja Graphs & Charts
 Pro:Warnings Notifications